Creating daily analyses of surface air temperature globally
On the basis of time series of air temperature (minimum, average and maximum; daily values) many different temperature indices can be derived. These indices are often used in specific sectors or used for a more general public. The indices give an (indirect) indication of the impacts of the climate or climate change. The (change) in e.g. the number of ice days (maximum temperature below 0 ˚C) gives an indication of the accessibility of unpaved roads in Scandinavia during winter; or the number of tropical nights (minimum temperature of 20 ˚C or higher) can be an indication of heat stress. At the website of ECA&D (European Climate Assessment Database) a large number of indices is generated. Similar databases are set up also for part of South America (LACA&D), and South East Asia (SACA&D).
Station data are only available for a limited number of locations, but people may also want to have data for their own particular location. To overcome this, station data can be interpolated in a sophisticated way (e.g. taking into account the effect of height on temperature, or the effect of the presence of the sea or large water bodies). The resulting gridded datasets give estimates of the e.g. area average temperature in the past on locations where no observations took place. An example of such a dataset is the E-OBS data set. However, the spatial resolution and accuracy depends very much on the density of stations (see figure 1). For temperature, also satellite data can be used. The advantage is the good spatial coverage and higher resolution. Satellites measure “skin temperature”, although more often air temperature is used for indices. However, skin temperatures can be used to estimate air temperatures. EUSTACE is an example of such a data set, where the measured surface skin temperature is translated to the air temperature by determining the relationships for several surfaces over land, oceans, ice and lakes.
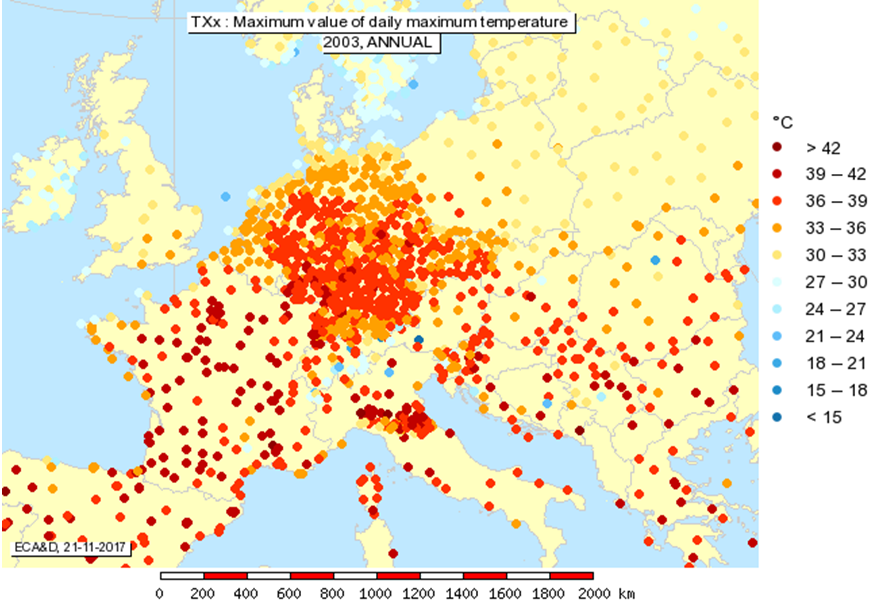
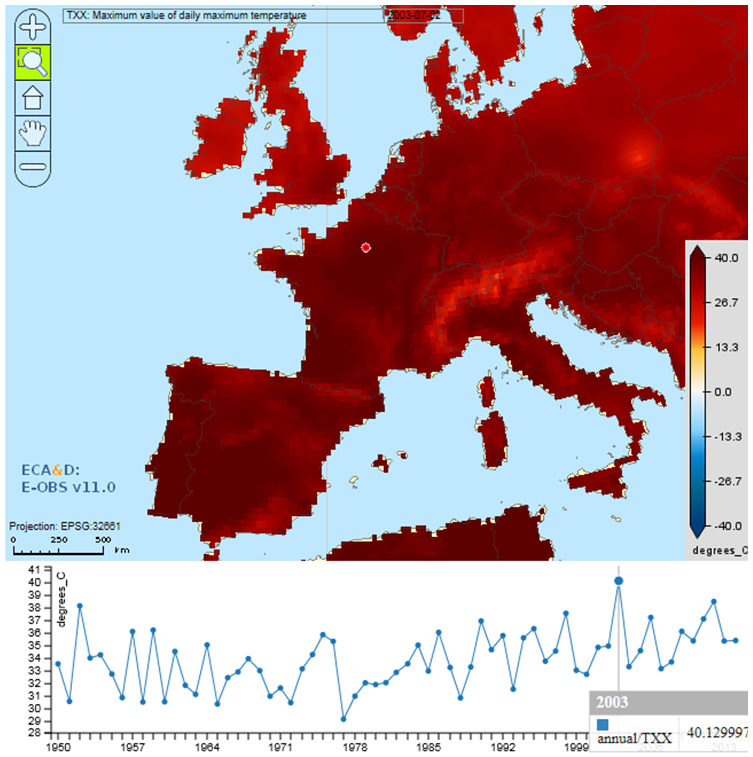
Figure 1 Example from the ECA&D website for the maximum value of the maximum temperature in the year 2003 (high temperatures in a large part of Europe). On top: information based on station data; Bottom: information based on interpolated station data.
Where limited station data are available, the satellite data can be of added value for determining more local temperature indices, since they have complete spatial coverage (at least the infilled EUSTACE dataset) at relatively high spatial resolution. For the land area where the Latin American version of ECA&D, LACA&D, is working, less station data are available than for Europe in ECA&D. The length of the time series may in general also be shorter. Besides, the EUSTACE dataset will also provide average daily air temperatures above other surface than land (e.g. the ocean). With the EUSTACE data various indices can be calculated at a higher spatial resolution than possible until now.
It is, however, important to take into account the accuracy or uncertainty of the daily air temperature estimates in the EUSTACE-dataset. The uncertainty information that will be provided with the EUSTACE dataset, makes it possible to calculate the uncertainty in the indices. For many indices the uncertainty cannot be calculated by just using the uncertainty measure that is given in the file with the “best estimate”. The value of the index depends very much on the absolute daily value: in the case of an estimated minimum temperature of -0.5 ˚C with a standard deviation of about 1 ˚C the values minus or plus 1 standard deviation would range from -0,5 to 1.5˚ C. When calculating the number of frost days (minimum temperature of 0 ˚C or lower), on one side of the range the day would be considered a frost day, whereas on the other side of the range not. The use of an ensemble of time series, together describing well the total uncertainty would in that case be the most appropriate way to determine the uncertainty of the index “frost days”.